SALMON STOCK COMPARISON
TABLE 1 (2)
This table focuses on the US stock of atlantic salmon as a whole, which shows that it has fluctuated a great deal since 1967. This table also shows that the proportion of wild salmon returns to hatchery salmon returns has shifted from predominantly wild to predominantly hatchery. 2SW fish consistently are the largest group of fish returning. This is a good sign, since 2SW are usually larger and carry more eggs than 1SW salmon. The stock steadily dropped until 1972, when there were 1,025 fish returning to the US rivers. The stock suddenly skyrocketed in the late 70s through the early 90s. This was the age of regulations for atlantic salmon in the US, including the creation of NASCO. It is important to note that although the number of returning wild salmon did increase during this time period, the number of returning hatchery fish made up the bulk of the population. In 1986 when the population was at its peak, hatchery fish made up almost 90% of the returning fish. These huge numbers of hatchery fish were most likely the result of increased effort of restocking natural populations. The stock remained in the low thousands until 2000. The number of natural fish returning has remained in the hundreds up to 2013. Numbers for fish from hatcheries remained in the thousands almost consistently until 2011, the anomaly being in 2007 there were 940 hatchery fish. In 2011, the population increased to 4,178. This sudden boost in may have been a direct result of being placed under the Endangered Species Act in 2009. After 2011, the stock continued to decline. It is quite possible that even though conservation efforts have increased over the last couple decades, the development of riverbanks and estuaries, creation of dams, and an increase in pollution have been too much for the salmon populations to withstand. It is also possible that the US stock has dipped below its critical number. If this is the case, restocking needs to happen faster, because wild salmon will not be able to renew themselves.
This table focuses on the US stock of atlantic salmon as a whole, which shows that it has fluctuated a great deal since 1967. This table also shows that the proportion of wild salmon returns to hatchery salmon returns has shifted from predominantly wild to predominantly hatchery. 2SW fish consistently are the largest group of fish returning. This is a good sign, since 2SW are usually larger and carry more eggs than 1SW salmon. The stock steadily dropped until 1972, when there were 1,025 fish returning to the US rivers. The stock suddenly skyrocketed in the late 70s through the early 90s. This was the age of regulations for atlantic salmon in the US, including the creation of NASCO. It is important to note that although the number of returning wild salmon did increase during this time period, the number of returning hatchery fish made up the bulk of the population. In 1986 when the population was at its peak, hatchery fish made up almost 90% of the returning fish. These huge numbers of hatchery fish were most likely the result of increased effort of restocking natural populations. The stock remained in the low thousands until 2000. The number of natural fish returning has remained in the hundreds up to 2013. Numbers for fish from hatcheries remained in the thousands almost consistently until 2011, the anomaly being in 2007 there were 940 hatchery fish. In 2011, the population increased to 4,178. This sudden boost in may have been a direct result of being placed under the Endangered Species Act in 2009. After 2011, the stock continued to decline. It is quite possible that even though conservation efforts have increased over the last couple decades, the development of riverbanks and estuaries, creation of dams, and an increase in pollution have been too much for the salmon populations to withstand. It is also possible that the US stock has dipped below its critical number. If this is the case, restocking needs to happen faster, because wild salmon will not be able to renew themselves.
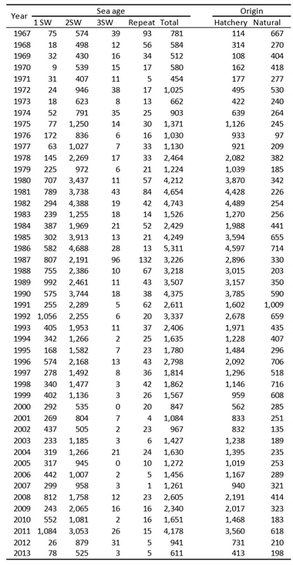
TABLE 2 (2)
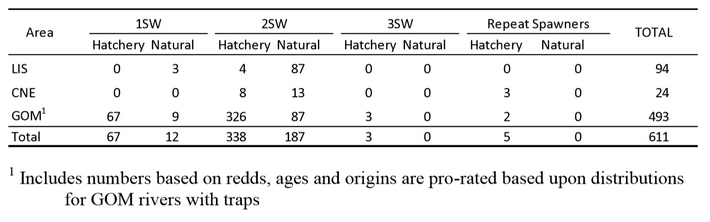
This table shows the estimated atlantic salmon returns based on location for the year 2013. The three main stocks of atlantic salmon in the US Long Island Sound (LIS), Central New England (CNE), and Gulf of Maine (GOM). This table shows that the LIS stock and CNE stock are virtually non-existent, and that 80% of the US population is in the GOM stock. This stock is most likely the greatest because the GOM is colder, and the rivers are less developed than those of LIS or CNE. Also, restocking efforts are focused on the GOM stock. LIS is probably almost gone because it is a highly developed region, making it almost impossible for salmon to survive.
This table shows the estimated atlantic salmon returns based on location for the year 2013. The three main stocks of atlantic salmon in the US Long Island Sound (LIS), Central New England (CNE), and Gulf of Maine (GOM). This table shows that the LIS stock and CNE stock are virtually non-existent, and that 80% of the US population is in the GOM stock. This stock is most likely the greatest because the GOM is colder, and the rivers are less developed than those of LIS or CNE. Also, restocking efforts are focused on the GOM stock. LIS is probably almost gone because it is a highly developed region, making it almost impossible for salmon to survive.